Nvidia-Aktien werden auf den Watchlisten stehen, da der AI-Favorit sich…

Nvidia shares will be on watchlists as the AI favorite prepares to release its highly anticipated quarterly report after the market closes on Wednesday.
The chipmaker, known for beating Wall Street expectations on strong demand for its lineup of AI silicon, is expected to report a 73% jump in fourth-quarter revenue from a year ago and post net income of $21.08 billion, up from $12.84 billion. Nvidia shares are trading flat for the year but have gained 12% this month through Friday’s close, with analysts remaining bullish on the chipmaker’s stock as major technology hyperscalers increase spending on AI infrastructure. The stock fell 4.1% to $134.43 on Friday amid a broader sell-off on Wall Street.
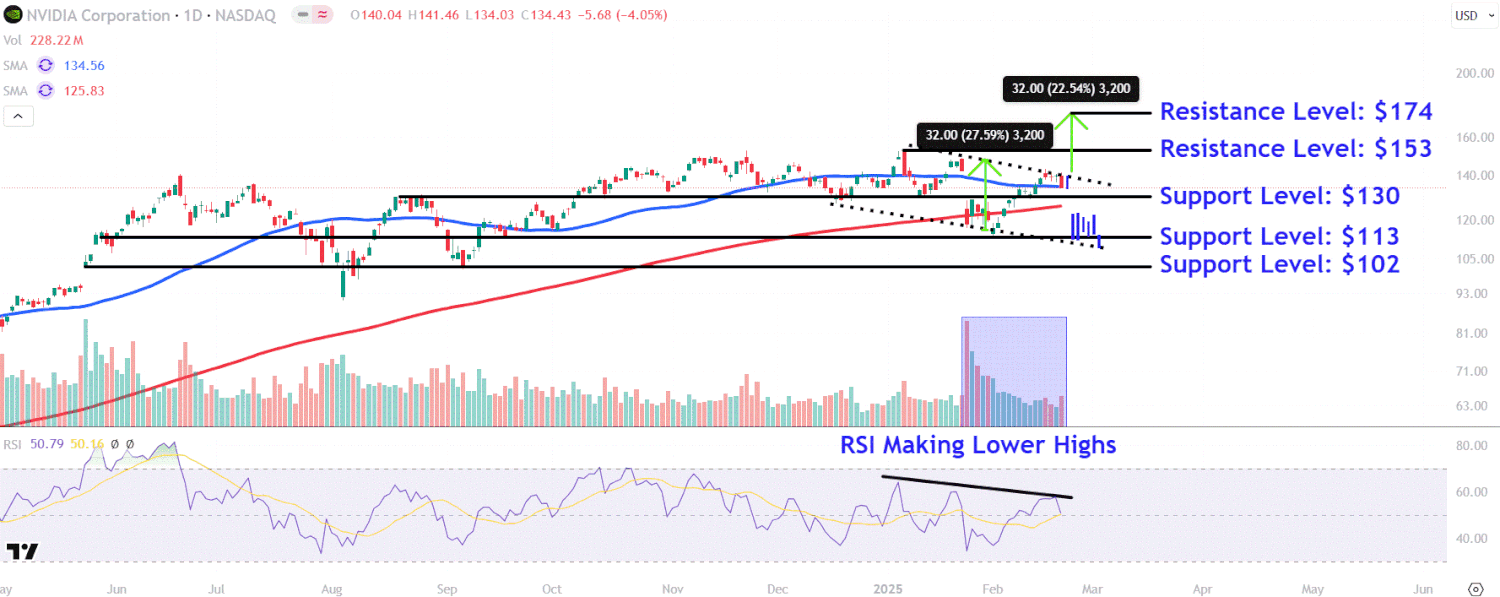
Nvidia shares have been consolidating in a descending channel since mid-December, with trading volume declining during that period.
Recently, a bearish engulfing pattern formed on the chart on Friday, indicating a potential downside move ahead of the chipmaker’s earnings. Interestingly, this same candlestick pattern has already occurred twice since the stock hit its record high in early January, and both times, further selling pressure followed. The Relative Strength Index (RSI) has mimicked the price, making lower highs since the beginning of the descending channel, indicating waning buying pressure.
Let’s identify some key support and resistance levels on Nvidia’s chart that investors could keep an eye on.
The first lower level is around $130. Shares could find support in this area, near a trendline connecting the prominent August peak to the lows formed on the chart in December and January. Selling below this level could send shares falling to the $113 level. Investors could look for buying opportunities in this region, near this month’s swing low, which closely coincides with a series of comparable trading levels on the chart since May of last year. This area is also just above the projected target of a bar pattern that reverses the stock’s downward move in late January and repositions it from the upper trendline of the descending channel. A sharper decline in Nvidia shares following quarterly results could bring the $102 level into play, an area on the chart where shares could find support near the opening price of the breakaway gap in late May and a range of prices around the lows in August and September. A breakout above the upper trendline of the descending channel could initially see shares make another attempt at the $153 level. This area on the chart would likely offer resistance near the stock’s all-time high.
Finally, investors can forecast a bullish target above the all-time high by using the measurement method, also known as the measurement principle.
To apply the analysis, we calculate the width of the descending channel in points and add that amount to the upper trendline of the pattern. For example, we add $32 to $142, which predicts a target of $174, a level almost 30% above Friday’s close and at which investors could decide to take profits.
Source: Investopedia